tcpdump snippets

- https://hackertarget.com/tcpdump-examples/
- https://danielmiessler.com/p/tcpdump/
- https://www.redhat.com/en/blog/tcpdump-part-2
- https://edoceo.com/sys/tcpdump
- https://github.com/tcpdump-examples/how-to-use-tcpdump
- https://community.exabeam.com/s/article/tcpdump-cheat-sheet
Some useful stuff related to using tcpdump
tcpdump is a data-network packet analyzer computer program that runs under a command line interface. It allows the user to display TCP/IP and other packets being transmitted or received over a network to which the computer is attached.
Tcpdump works on most Unix-like operating systems: Linux, Solaris, FreeBSD, DragonFly BSD, NetBSD, OpenBSD, OpenWrt, macOS, HP-UX 11i, and AIX. In those systems, tcpdump uses the libpcap library to capture packets. The port of tcpdump for Windows is called WinDump; it uses WinPcap, the Windows ersion of libpcap.

List interfaces
To list the interfaces available for sniffing you can use this option:
tcpdump -DExample output:
1.enp1s0 [Up, Running, Connected]
2.any (Pseudo-device that captures on all interfaces) [Up, Running]
3.lo [Up, Running, Loopback]
4.eno1 [Up, Disconnected]
5.virbr0 [Up, Disconnected]
6.docker0 [Up, Disconnected]
7.nflog (Linux netfilter log (NFLOG) interface) [none]
8.nfqueue (Linux netfilter queue (NFQUEUE) interface) [none]
The -D or --list-interfaces option prints the list of the network interfaces
available on the system and on which tcpdump can capture packets. For each network
interface, a number and an interface name, possibly followed by
a text description of the interface, are printed. The interface
name or the number can be supplied to the -i flag to specify an
interface on which to capture.
This can be useful on systems that don't have a command to list
them (e.g., Windows systems, or UNIX systems lacking ifconfig -a); the number can be useful on Windows 2000 and later systems,
where the interface name is a somewhat complex string.
GUI
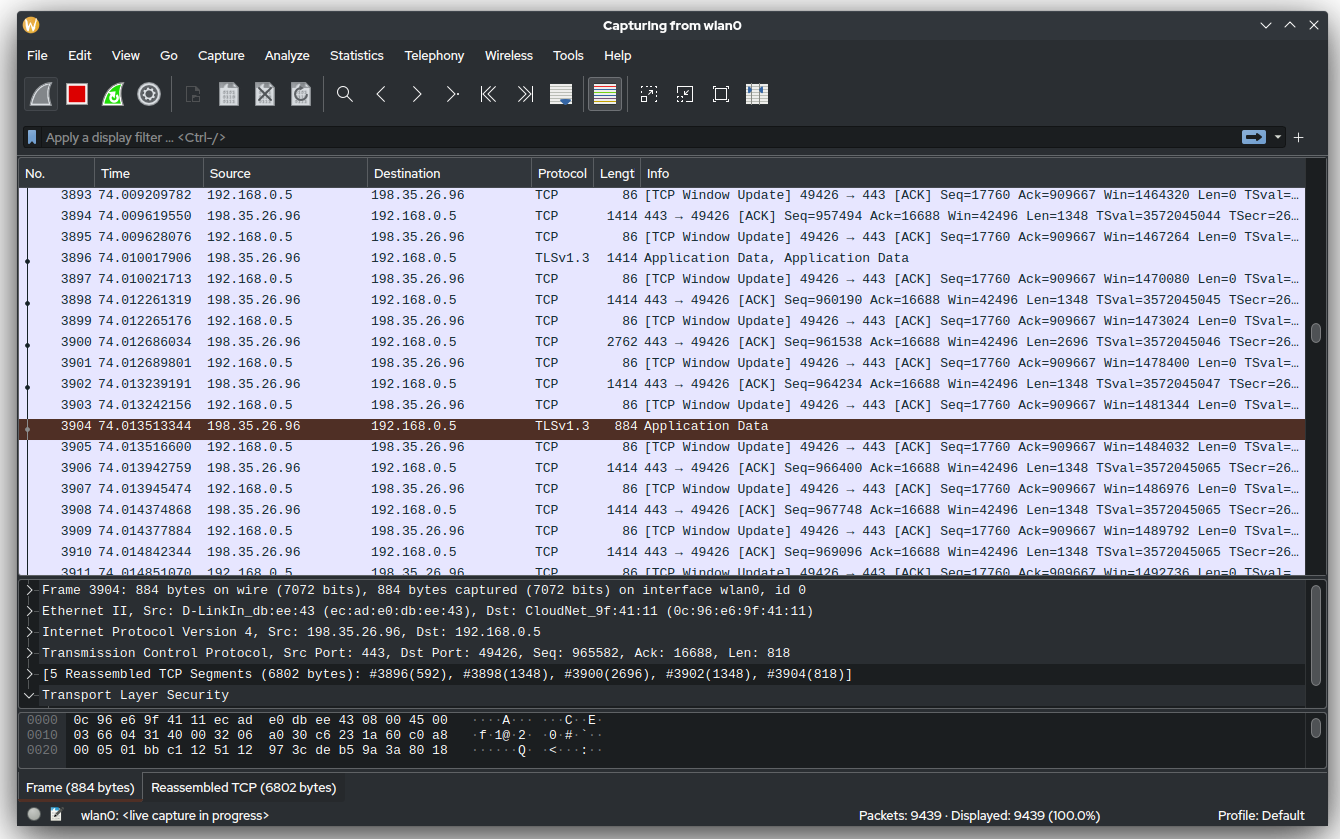
tcpdump is a command line tool. If you prefer to have a full GUI interface you can use Wireshark.

Wireshark is an open-source packet analyzer. It is used for network troubleshooting, analysis, software and communications protocol development, and education. Originally named Ethereal, the project was renamed Wireshark in May 2006 due to trademark issues.
Wireshark is cross-platform, using the Qt widget toolkit in current releases to implement its user interface, and using pcap to capture packets; it runs on Linux, macOS, BSD, Solaris, some other Unix-like operating systems, and Microsoft Windows. There is also a terminal-based (non-GUI) version called TShark.

A feature of Wireshark is that it can also analyze capture traces from tcpdump. See Capturing with “tcpdump” for viewing with Wireshark
The use case is for example you have a router, switch or a headless system. You can use tcpdump to capture traffic and analyze it off-line by reading it into Wireshark.
To capture for off-line analysis use the command:
tcpdump -i <interface> -s 65535 -w <file>Older versions of tcpdump when writing to file would truncate packets to 68 or 96 bytes.
Current versions default to 262144 bytes. Use the -s options to set the max packet size to
capture, or use the -S option to get the entire packet. Since this impacts the total size of the file, you can use it to tweak the disk
usage. You can pair this with option -c to specify the number of packets to capture.
You can use tcpdump -r option to analyze captured traffic files.
# tcpdump -r dns.pcap
reading from file dns.pcap, link-type LINUX_SLL2 (Linux cooked v2), snapshot length 262144
Warning: interface names might be incorrect
dropped privs to tcpdump
20:33:45.240421 wlp0s20f3 Out IP kkulkarni.attlocal.net.37376 > dsldevice.attlocal.net.domain: 8860+ PTR? 89.1.168.192.in-addr.arpa. (43)
20:33:45.250107 wlp0s20f3 In  IP dsldevice.attlocal.net.domain > kkulkarni.attlocal.net.37376: 8860* 1/0/0 PTR kkulkarni.attlocal.net. (79)
20:33:45.253418 wlp0s20f3 Out IP kkulkarni.attlocal.net.54366 > dsldevice.attlocal.net.domain: 23092+ PTR? 1.112.168.192.in-addr.arpa. (44)
20:33:45.260212 wlp0s20f3 In  IP dsldevice.attlocal.net.domain > kkulkarni.attlocal.net.54366: 23092 NXDomain* 0/0/0 (44)
Capture file rotation
You can make tcpdump automatically rotate files. Example:
tcpdump -i en0 -G 1800 -C 100 -w /var/tmp/trace-%H-%M.pcapOptions:
-Cfilesize
Before writing a raw packet to a savefile, check whether the file is currently larger than filesize and, if so, close the current savefile and open a new one. Savefiles after the first savefile will have the name specified with the-wflag, with a number after it, starting at 1 and continuing upward. The units of filesize are millions of bytes (1,000,000 bytes, not 1,048,576 bytes).-Grotateseconds
If specified, rotates the dump file specified with the-woption every rotateseconds seconds. Savefiles will have the name specified by-wwhich should include a time format as defined by strftime (3).
If no time format is specified, each new file will overwrite the previous. Whenever a generated filename is not unique, tcpdump will overwrite the preexisting data; providing a time specification that is coarser than the capture period is therefore not advised.
If used in conjunction with the-Coption, filenames will take the form of file<count>.-W
Used in conjunction with the-Coption, this will limit the number of files created to the specified number, and begin overwriting files from the beginning, thus creating a 'rotating' buffer. In addition, it will name the files with enough leading 0s to support the maximum number of files, allowing them to sort correctly.
Used in conjunction with the-Goption, this will limit the number of rotated dump files that get created, exiting with status 0 when reaching the limit.
If used in conjunction with both-Cand-G, the-Woption will currently be ignored, and will only affect the file name.
stftime codes
- %m=month
- %d=day of month
- %H=hour of day
- %M=minute of day
- %S=second of day
- %s=millisecond of day
Filter by MAC address
tcpdump supports the ether qualifier to specify ethernet addresses in the
standard colon-separated format. For example, to capture any broadcast traffic,
$ tcpdump ether dst ff:ff:ff:ff:ff:ffTo capture any traffic sent to or from a given MAC address,
$ tcpdump ether host e8:2a:ea:44:55:66(Here the first three octets identify the MAC in question as belonging to an
Intel NIC, e8:2a:ea being an OUI assigned to Intel.)
Reference: https://www.pico.net/kb/how-does-one-filter-mac-addresses-using-tcpdump/
Monitor DHCP network traffic
The tcpdump command can be used to monitor DHCP related network traffic. This is very useful in cases where DHCP issues may have to be investigated. Basically, the tcpdump command can be used to do some packet sniffing on the network.
The method to capture DHCP traffic is to define a filter so that tcpdump
dumps only DHCP related traffic. In DHCP, UDP port number 67 is used by a DHCP
server, and UDP port number 68 is used by DHCP clients. Thus, you want to capture
traffic with port number 67 or 68 as follows, assuming that eth0 is the
network interface that will be used to monitor:
# tcpdump -i eth0 port 67 or port 68 -e -n -vvBy using the -vv option (for very verbose) you may see a lengthy output
from the tcpdump command displaying a lot of information. In it you can see
which DHCP server is responding, and what IP address is assigned. For example:
Client-ID Option 61, length 7: ether ec:9b:f3:6b:97:4b
Requested-IP Option 50, length 4: 192.168.0.3
Server-ID Option 54, length 4: 192.168.0.1
MSZ Option 57, length 2: 1500
Vendor-Class Option 60, length 16: "android-dhcp-7.0"
Hostname Option 12, length 16: "SAMSUNG-SM-G890A"
In the example above, you can see that a Samsung SM-G890A phone, running
Android, gets IP address 192.168.0.3 assigned from DHCP server 192.168.0.1.
You can also see the MAC (or "hardware") address of the phone: ec:9b:f3:6b:97:4a.
One you're finished sniffing the network for DHCP related traffic, you can
simply CTRL-C out of the tcpdump command.
Reference: https://unixhealthcheck.com/blog?id=433
For IPv6 the command is slightly different:
# tcpdump -i <interface name> -n -vv '(udp port 546 or 547) or icmp6'In IPv6, DHCP is using different ports. Also, some of the configuration items are sent via ICMP6.
Monitoring LLDP traffic
tcpdump -i eth0 -v -e ether proto 0x88cc -inic : Select the interface-vor-vv: more protocol decoding-e: Show Ethernet Frame fieldsether proto 0x88cc: select LLDP frames (Protocol ID0x88cc)
Showing vlan traffic
You can verify the incoming traffic to see if they have VLAN tags by using tcpdump with
the -e and vlan option.
This will show the details of the VLAN header:
tcpdump -i bond0 -nn -e vlanReference: https://access.redhat.com/solutions/2630851
Filtering tagged/untagged VLAN (IEEE 802.1Q) traffic
If you want use a tcpdump filter that matches both tagged and untagged traffic you have to watch out for the fact that using VLAN changes the way the traffic is encapsulated. The issue is that tagging traffic inserts four more bytes (namely the VLAN ID) to the ethernet (or more precisely IEEE 802.1Q) header. Without specifically asking for VLAN traffic in the BPF filter, every traffic is parsed as untagged traffic. Thus, the specified filter delivers only untagged UDP packets (i.e., their frames) and drops all tagged traffic.
Now watch out: similar things happen if you specify the mysterious vlan keyword
in the tcpdump filter. After specifiying the vlan keyword, the subsequent
filters are matched against traffic shifted by 4 bytes to the right. Note that this
is also true if you specify not vlan as filter.
If we want to match both tagged and untagged UDP traffic, we have to specify the following filter:
Filter UDP traffic, both VLAN tagged and untagged:
tcpdump -nn -d "udp or (vlan and udp)"Or, the generic solution:
Generic filter expression that matches VLAN tagged and untagged traffic:
tcpdump -nn -d "<filter> or (vlan and <filter>)"If you want to filter only untagged traffic, specify the following:
Generic filter to match only untagged traffic:
tcpdump -nn -d <filter> and not vlanLong story short: When using tcpdump (or libpcap), be careful where to put the
vlan keyword in your expression. In general, it's a very bad idea to specify the
keyword twice, unless you pack VLAN traffic into VLAN traffic. Maybe these examples
are more explanative than the quote below taken from the tcpdump
manpage:
Note that the first vlan keyword encountered in expression changes the decoding offsets for the remainder of expression on the assumption that the packet is a VLAN packet.
Recall this (admittedly sometimes strange) behavior is not a bug...
Reference: https://www.christian-rossow.de/articles/tcpdump_filter_mixed_tagged_and_untagged_VLAN_traffic.php
Using ngrep
tcpdump uses berkeley packet filter expressions to select the packets to analyze. If you prefer to use regular expressions you can use ngrep.
ngrep (network grep) is a network packet analyzer. It has a command-line interface, and relies upon the pcap library and the GNU regex library.
ngrep supports Berkeley Packet Filter (BPF) logic to select network sources or destinations or protocols, and also allows matching patterns or regular expressions in the data payload of packets using GNU grep syntax, showing packet data in a human-friendly way.
Examples:
- Capture network traffic incoming/outgoing to/from eth0 interface and show parameters following
HTTP (TCP/80) GET or POST methods:
ngrep -l -q -d eth0 -i "^GET |^POST " tcp and port 80 - Capture network traffic incoming/outgoing to/from eth0 interface and show the HTTP (TCP/80)
User-Agent string
ngrep -l -q -d eth0 -i "User-Agent: " tcp and port 80 - Capture network traffic incoming/outgoing to/from eth0 interface and show the DNS (UDP/53)
querys and responses
ngrep -l -q -d eth0 -i "" udp and port 53
Piping tcpdump output
When piping tcpdump output to another command you should enable line buffered mode with -l or -C.
Without the option to force line (-l) buffered (or packet buffered -C) mode you will not
always get the expected response when piping. By using this option the output is sent
immediately to the piped command.
tcpdump -nl | awk '/10.14.34.132/'
tcpdump -i eth0 -s0 -l port 80 | awk '/Server:/'
Ref: https://community.exabeam.com/s/article/tcpdump-cheat-sheet
Printing packets in ASCII or Hex
Print each packet (minus its link level header) in ASCII with -A.
Handy for capturing web pages. Also note that -x can be used for ASCII and hex characters.
tcpdump -A -vv -i eno1
tcpdump -x -vv -i eno1
Same as -X, but also shows the ethernet header.
tcpdump -XXQuieter
Using -q supresses some protocol information, -t supresses timestamps.
tcpdump -q -i eth0
tcpdump -t -i eth0
tcpdump -A -n -q -i eth0 'port 80'
tcpdump -A -n -q -t -i eth0 'port 80'